Fragrance Deconvolution
A modern fine fragrance can be composed of more than 50 ingredients, and most of them are multi-components such as essential oils or mixture of several isomers. Therefore, to obtain a good identification and quantification of each single molecule is necessary to apply the state-of-the-art in technology apart from, of course, skilled analysts.
Speaking about chromatography and innovation, there is two ways of improvement: Through hardware or through software. ChromEssence continuously improves the methodology of fragrance compound identification, trying to “squeeze” the most out of software techniques to achieve very good accuracies at the lowest possible cost.
One of these improvements is the application of an algorithm called “deconvolution” to the GC/MS signals. Deconvolution is a process of resolving something into its constituent elements or removing complication. It is used in signal processing and image processing.
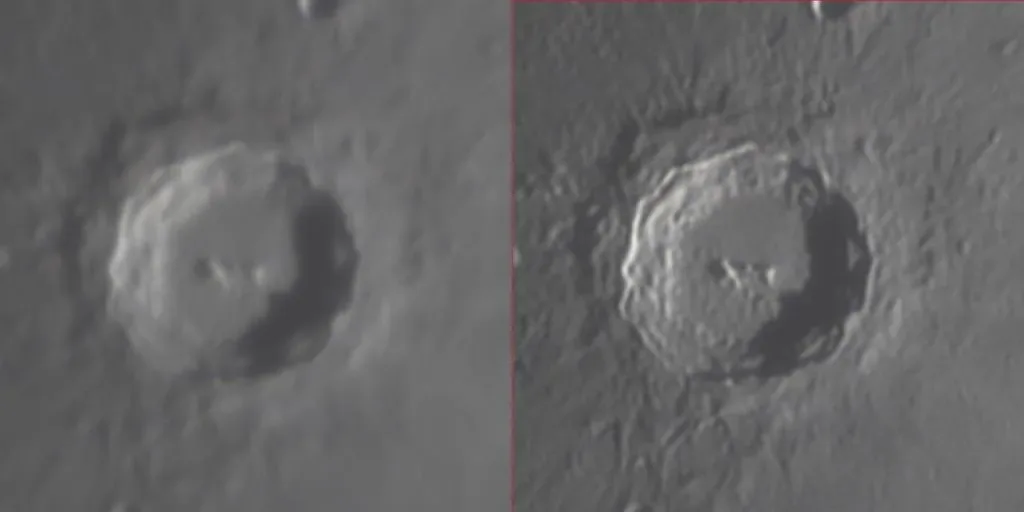
For example, convolution can be used to apply a filter, and it may be possible to recover the original signal using deconvolution, as showed in the following images of a lunar crater.
In terms of chromatography, Deconvolution is a process for extracting ions from a complex total ion chromatogram (TIC), even with the target compound signal at trace levels. It is a term often applied to the process of decomposing peaks that overlap with each other, thus extracting information about the “hidden peaks”. The software used for this technique is AMDIS developed by NIST.
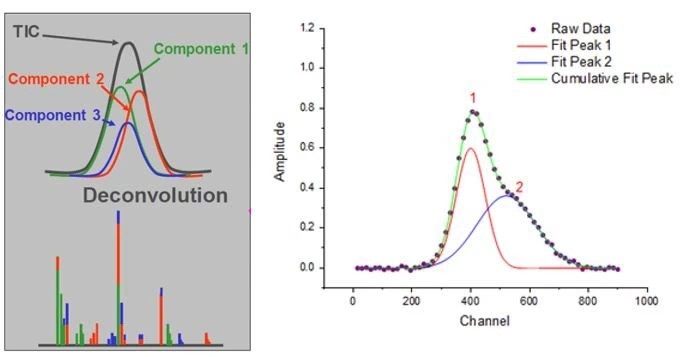
As shown in the image above, when several peaks co-elute and form a new peak that “clusters” several compounds, and thus several spectra, a “mixture” of these spectra is shown in a typical Total Ion Chromatogram scan (TIC).
As explained in several application notes from Agilent Technologies, it can be solved extracting all the ion chromatograms , and their “apex retention time” from the “mixed” spectra obtained inside the peak, and the shapes of these chromatograms can be used to group ions and find hidden peaks, as we can see at the following scheme:
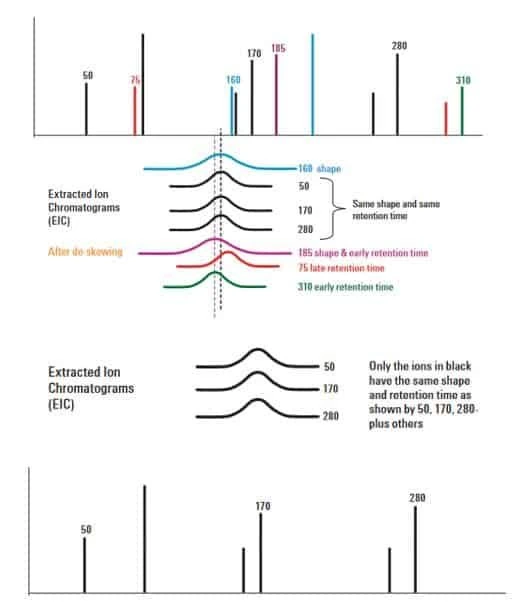
Therefore these deconvoluted ions are grouped together as a component.
In the practice, the complex fragrance chromatograms must be processed through special deconvolution methods which has been optimized for these matrices, setting a long list of parameters such as RT window sized, the sharpness threshold, etc.
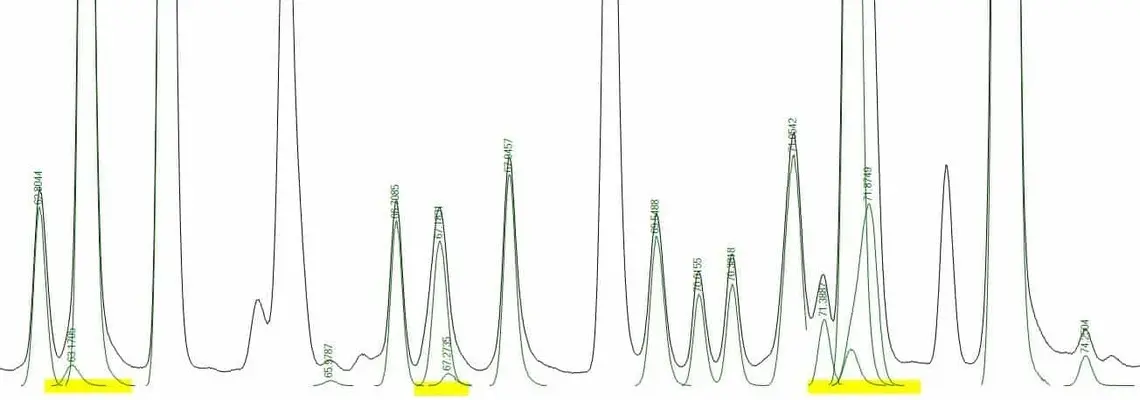
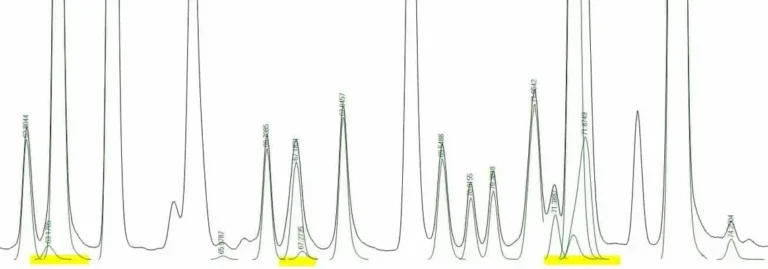
In the following image, we can see a real fragrance analysis and the difference between a “normal” TIC signal and a deconvoluted signal, being the black signal the usual obtained by a routine-based laboratory. In ChromEssence, we additionally obtain the green signal, which is the information about “hidden” compounds: